Press Releases
Canadian consumers catch their collective breath
Some concerning signals from Q1 dissipate
TORONTO, September 17, 2019 – Equifax® Canada’s report on Canadian consumer credit in Q2 shows some cooling after a very active Q1 performance. Total debt per consumer rose by 1.9 per cent to $71,970 at the end of the second quarter in 2019. That comes after a robust 2.6 per cent growth in average debt in the first quarter.
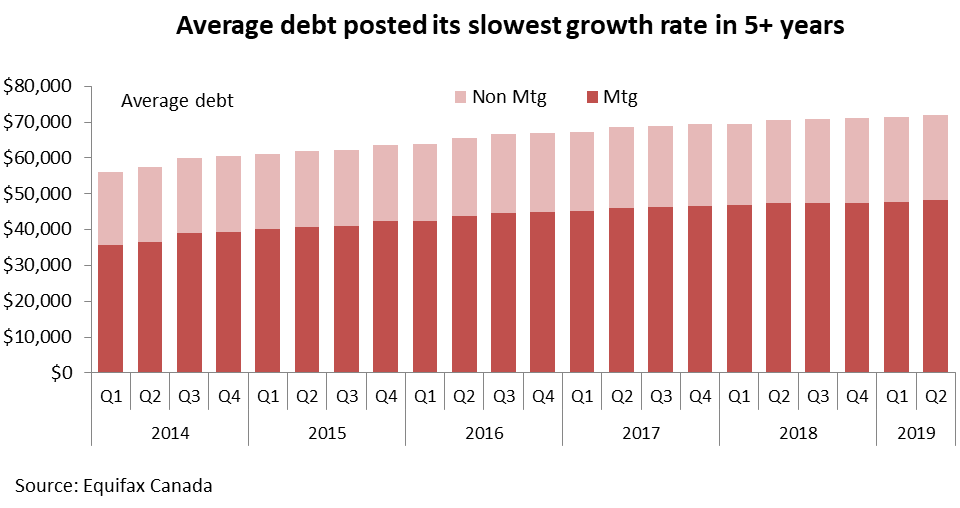 Mortgage debt growth continued to decelerate, with a 1.8 per cent increase to $48,225 per consumer. Non-mortgage debt rose by 2 per cent to $23,745. This compares to a much larger 3% growth rate in the previous quarter.
“It looks like, after turning to credit to clear their winter blues, consumers were able to get back on a more reasonable track through the spring,” said Bill Johnston, Vice President of Data & Analytics at Equifax Canada. “There were some troubling signs in the first quarter, with credit card usage and average debt rising sharply for some vulnerable consumer groups. The results in the last quarter are much more aligned to the current economic situation.”
Delinquency has turned higher
The rate at which consumers were missing monthly payments was higher in Q2, as the 90-day-plus delinquency rates turned slightly higher again. At 1.12 per cent (+5.8%), delinquency rates for non-mortgage products have erased the gains posted in the previous 2 years. Quebec (-0.3%) was the only province to post a slight improvement in delinquency in the quarter. Newfoundland (+11%), Alberta (7.9%) and Ontario (7.8%) led the way higher.
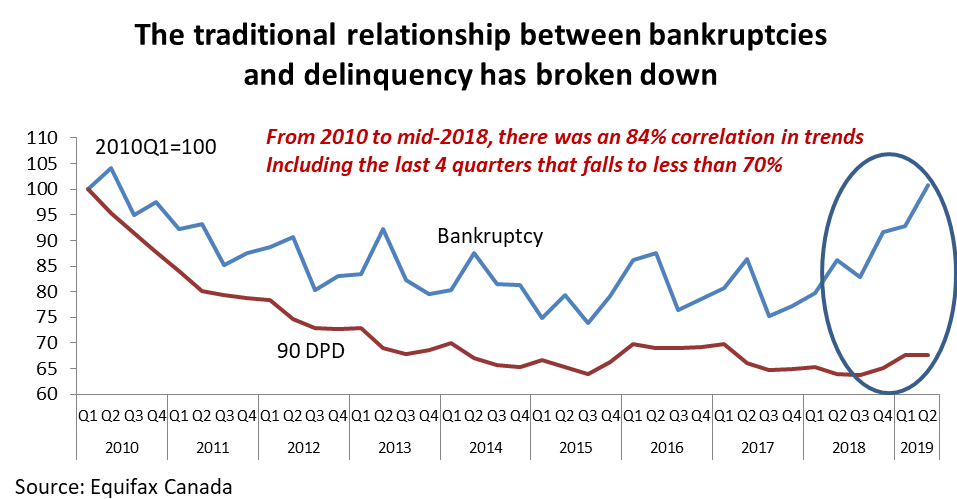 Delinquency was also higher for mortgages in the second quarter. At 0.18 per cent, the 90-day-plus delinquency rate for mortgages rose by 9.3 per cent in the latest quarter, representing the third straight increase. British Columbia (+29%), Alberta (+17%) and Ontario (+16%) had the most significant increases, though, in the case of Ontario and British Columbia, the magnitude reflects the very low levels of delinquency.
“The delinquency trend is rising but the magnitude has been muted by the sharp jump in bankruptcies,” added Mr. Johnston. “Traditionally, the trends in delinquency and bankruptcy have been highly connected. That has completely broken down since mid-2018, with bankruptcy outpacing delinquency significantly.”
A hold on interest rates provides a break
“The current holding pattern at the Bank of Canada provides consumers with an opportunity to balance their financial situation” concluded Mr. Johnston. “It can help keep delinquency rate increases in check. The concern, particularly if rates are cut, is that consumers could overextend themselves further. Any rate cuts are likely short term. Locking into low fixed rates and avoiding overusing credit cards is a prudent strategy to follow if rates drop,” advises Mr. Johnston.
Debt (excluding mortgages) & Delinquency Rates
|
Age |
Average Debt |
Average Debt Change Year-over-Year |
Delinquency Rate |
Delinquency Rate Change Year-over-Year |
|
18-25 |
$ 8,613 |
1.89% |
1.69% |
3.55% |
|
26-35 |
$18,198 |
1.36% |
1.60% |
6.03% |
|
36-45 |
$28,791 |
1.98% |
1.27% |
4.67% |
|
46-55 |
$35,986 |
3.02% |
0.95% |
5.44% |
|
56-65 |
$30,261 |
2.70% |
0.85% |
6.71% |
|
65+ |
$16,549 |
2.88% |
0.98% |
7.13% |
|
Canada |
$23,745 |
2.04% |
1.12% |
5.76% |
Major City Analysis – Debt (excluding mortgages) & Delinquency Rates
|
City |
Average Debt |
Average Debt Change Year-over-Year |
Delinquency Rate |
Delinquency Rate Change Year-over-Year |
|
Calgary |
$29,981 |
0.40% |
1.30% |
11.30% |
|
Edmonton |
$28,787 |
1.40% |
1.49% |
4.40% |
|
Halifax |
$23,662 |
-0.30% |
1.54% |
6.70% |
|
Montreal |
$17,963 |
2.00% |
1.19% |
-1.20% |
|
Ottawa |
$22,884 |
1.90% |
0.92% |
-1.50% |
|
Toronto |
$23,371 |
3.70% |
1.18% |
8.00% |
|
Vancouver |
$26,778 |
1.30% |
0.75% |
12.40% |
|
St. John's |
$25,456 |
0.20% |
1.70% |
11.50% |
|
Fort McMurray |
$39,466 |
1.30% |
1.75% |
3.60% |
Province Analysis - Debt (excluding mortgages) & Delinquency Rates & Bankruptcy Amount
|
Province |
Average Debt |
Average Debt Change Year-over-Year |
Delinquency Rate |
Delinquency Rate Change Year-over-Year |
|
Ontario |
$24,333 |
3.3% |
1.00% |
7.8% |
|
Quebec |
$19,672 |
2.2% |
0.99% |
-0.3% |
|
Nova Scotia |
$22,622 |
-0.3% |
1.77% |
3.5% |
|
New Brunswick |
$23,725 |
0.8% |
1.83% |
7.2% |
|
PEI |
$23,210 |
1.4% |
1.31% |
0% |
|
Newfoundland |
$23,920 |
0.1% |
1.84% |
11.1% |
|
Eastern Region |
$23,287 |
0.2% |
1.77% |
6.2% |
|
Alberta |
$29,390 |
0.9% |
1.43% |
7.9% |
|
Manitoba |
$18,921 |
0.2% |
1.38% |
6.1% |
|
Saskatchewan |
$24,877 |
-1.5% |
1.52% |
4.2% |
|
British Columbia |
$25,031 |
1.2% |
0.89% |
7.7% |
|
Western Region |
$25,951 |
0.7% |
1.20% |
7.1% |
|
Canada |
$23,745 |
2.0% |
1.12% |
5.8% |
-------------------------
Data for the Equifax Canada 2019 Q2 National Consumer Credit Trends Report, including scores, is sourced from Equifax Canada, the repository of the majority of credit transactions that occur in Canada. There are over 25 million unique Equifax Canada consumer credit files. Transaction volumes for data are estimated at 105 million per month. Information provided in this report was adjusted to ensure that quarterly data reflects the results as of the last month of each quarter.
The information in this press release is published by Equifax Canada Co. © 2019 All rights reserved. This press release is for informational purposes only and is not legal advice and should not be used, or interpreted, as legal advice. The information is provided as is without any representation, warranty or guarantee of any kind, whether express or implied. Equifax will not under any circumstances be liable to you or to any other person for any loss or damage arising from, connected with, or relating to the use of this information by you or any other person. Users of this informational publication should consult with their own lawyer for legal advice.